Benchmarks
EDGE provides input and output data for a series wave propagation benchmarks. Currently, these are the following benchmarks:
| Name | Description |
|---|---|
| conv | 2D/3D convergence benchmarks, periodic boundary conditions. |
| garvin | Garvin’s problem (2D), acoustic/elastic, explosive point source. |
| ghill_2d | 2D Gaussian hill topography, acoustic/elastic, explosive point source. |
| ghcan_2d | 2D Gaussian hill-canyon topography, acoustic/elastic, explosive point source. |
| sanjacinto_2d | 2D Mount San Jacinto topography, elastic, explosive point source. |
| hsp1a | Homogeneous space, elastic, near receivers, single point source. |
| hsp2a | Homogeneous space, viscoelastic, near receivers, single point source. |
| hhs1 | Homogeneous halfspace, elastic, single point source. |
| loh1 | Layer over homogeneous halfspace, elastic, single point source. |
| loh2 | Layer over homogeneous halfspace, elastic, kinematic rupture. |
| loh3 | Layer over homogeneous halfspace, viscoelastic, single point source. |
| can4 | Three thin layers in a halfspace, reaching the surface at a low angle, elastic, single point source. |
| ssp0 | Layered velocity model, elastic, single point source. |
| ssef0 | Layered velocity model, elastic, kinematic rupture with variable parameters. |
| ghill | 3D Gaussian hill topography, elastic, double couple source. |
| sgt | 3D mountain topography, homogeneous, elastic, point forces for reciprocal solution. |
| la_habra | 2014 M5.1 La Habra, CA earthquake setting of SCEC’s High Frequency project. |
Input: Kinematic Sources
EDGE provides pre-generated kinematic source descriptions as assets. However, most are easily generated, since the moment rate time history of many wave propagation benchmarks is simply given by an analytic function. You might generate the sources through the script kinematic_bench.py.
HSP1a (regular) example:
python tools/processing/kinematic_bench.py --xml examples/bench/elastic/wp1/hsp1a/reg_src.xml
The template for the wave propagation bechmarks is located at tools/processing/kinematic_bench.cdl.
Sources for the other wave propagation setups can be generated by calling the respective XML-configurations, provided as assets.
LOH.2
The Layer Over Halfspace benchmark (LOH.2) is a purely elastic setup, consisting of a 1000m thick layer, having different material parameters (\(v_s=2000 \frac{\text{m}}{\text{s}}\), \(v_p=4000 \frac{\text{m}}{\text{s}}\), \(\rho = 2600 \frac{\text{kg}}{\text{m}^3}\)) than the half-space below (\(v_s=3464 \frac{\text{m}}{\text{s}}\), \(v_p=6000 \frac{\text{m}}{\text{s}}\), \(\rho = 2700 \frac{\text{kg}}{\text{m}^3}\)). Free-surface boundary conditions at the top of the layer are used, and outflow boundaries everywhere else. Source is a right-lateral strike-slip finite fault with a constant rupture velocity of \(3000\frac{\text{m}}{\text{s}}\). The source-time function is similar everywhere, since only the onset time is variable. A detailed description of the LOH.2 problem is given in the “Final Report to Pacific Earthquake Engineering Research Center, Lifelines Program Task 1A01, Tests of 3D Elastodynamic Codes”.
EDGE provides two setups solving the LOH.2 problem. This allows us to check consistency of the results, when using different features of the code.
The first setup, our “reference” solution, simply uses 40 isolated configurations, each with a single point source. The 40 point sources are located at the epicenter in y-direction and their associated patches cover the z-dimension of the entire finite fault. Each of the square patches has a size of \(100\text{m}\times 100\text{m}\). The effect of the remaining fault, with respect to the seismic receivers, is computed by simply shifting and adding the obtained solutions accordingly.
Illustration of the reference setup solving the LOH.2 benchmark. The 1000m thick layer is shown in gray, the finite fault in red, and the location of the hypocenter as a yellow star. 40 point sources (black and blue squares) with a finite fault size of 100m in y- and z-direction are used to derive EDGE’s “reference” solution. The patches are centered at the epicenter in y-direction, and cover the entire fault in z-direction.
The second setup uses a single simulation with a single kinematic source description. The kinematic source consists of a total of \(80 \times 40 = 3,200\) patches covering the entire finite fault. Each of the square patches has a size of \(100\text{m}\times 100\text{m}\).
Illustration of the kinematic source description for the LOH.2 benchmark. The 1000m thick layer is shown in gray and the location of the hypocenter as a yellow star. 3200 point sources (black and blue squares) with a finite-fault size of 100m in y- and z-direction are used to derive EDGE’s kinematic solution. The patches cover the entire finite fault.
Illustration showing the receiver-placement at the surface in gray, which is required to obtain the LOH.2 solution from isolated simulations. The fault is shown in red, the epicenter s1, indicating the location of the 40 point sources, is located at the yellow star. Three additional sources s2-s4 (extending in depth) are illustrated through yellow squares. We obtain the solution at receiver r1 with respect to the waves of s2-s4 by adding r2-r4 with respect to the waves generated by s1. Analogue, m1 is given by adding m2-m4.
By using identical meshes and convergence rates for both setup, we obtain almost identical numerical setups. Small differences, however, exist:
- The seismic waves, originating from the point sources in the second setup, propagate through different elements before reaching the considered receivers.
- The 40 point sources of the reference setup do not exist in the kinematic setup: The centers of the 40 fault patches are located on the boundaries of the second setup’s patches.
- We only executed EDGE five times for the provided solution of the first setup, and thus fused eight simulations per run.
For the second setup, only one non-fused forward simulation was used. Since EDGE uses different kernels for the seismic wave propagation component in the two cases, errors, resulting from machine precision, are present.
Can4
The Can4 benchmark is purely elastic and consists of a simple basin model with three layers, embedded in a half-space. A detailed description of the benchmark is given in SISMOWINE’s description. Discussions of benchmark results are presented in Earthquake Ground Motion in the Mygdonian Basin, Greece: The E2VP Verification and Validation of 3D Numerical Simulation up to 4 Hz - E. Maufroy et al. and “19 - Modelling of earthquake motion: Mygdonian basin” of the book The Finite-Difference Modelling of Earthquake Motions - P. Moczo, J. Kristek, M. Gális.
The layers of the benchmark are shallow and reach the surface at a low dipping angle (wedge). This poses a modeling challenge to numerical software. We model the layers explicitly by using a tetrahedral mesh and aligning the faces to the material contrasts. Further, we avoid ill-shaped elements in the spatial discretization, by vertically cutting off the last dipping part of the layers. Here, the cut-off is chosen, such that the resulting height of the first layer is not smaller than the characteristic length of the elements in the wedge. Despite not explicitly meshing the remainder of the wedge, we still used appropiate material parameters for elements after the cut-off. This results in an increased scattering of the seismic waves, since the material interface now follows the unstructured mesh.
Illustration showing the three layers of the Can4 benchmark. The red, dashed line shows the cut-off in EDGE’s assumed geometry, avoiding ill-shaped elements in the mesh. The result is a minimum thickness (blue) of the first layer, equal to the characteristic length of the elements in the wedge.
We mitigate the extreme ratio of the computional domain with respect to the depth of the layers, by using a problem-adapted mesh-refinement. Here, we use the highest refinement in the wedge of the three layers, which reduces the negative impact of the normalization through the cut-off. The remainder of the three layers and our region of interest, given by \([-5000\,\text{m},5000\,\text{m}]\times[-5000\,\text{m},5000\,\text{m}]\times[0,5000\,\text{m}]\) use tetetrahedral element sizes, matching the desired frequency content. The location of the point source is additionally refined by an attractor. This allows for sharper a discretization of discontinuities, and thus reduces errors, which might be introduced by insufficient source discretization through large element-sizes in the region of interest. In x-direction (south-north) and z-direction (depth), our region of interest is surrounded by a sponge layer with a coarse resolution.
Illustration showing the problem-adapted mesh refinement of our Can4 setup. The highest resolution is used for the dipping parts of the layers (red), followed by decreasing resolution in the three layers (darker to lighter gray). Further, the point source (yellow star) is refined with a distance-dependent, linear gradient of decreasing refinement (blue sphere), reaching the coarsest resolution at the boundary of the sphere. The resolution in the region of interest (light gray) is chosen to match our desired frequency content, while the remainder (white) is coarse and acts as a sponge layer.
La Habra
2014 Mw5.1 a Habra, CA earthquake setting of SCEC’s High-F project. The verification benchmark uses frequency-independent Q, a planar free surface, kinematic sources, and the velocity model CVM-S4.26.M01.

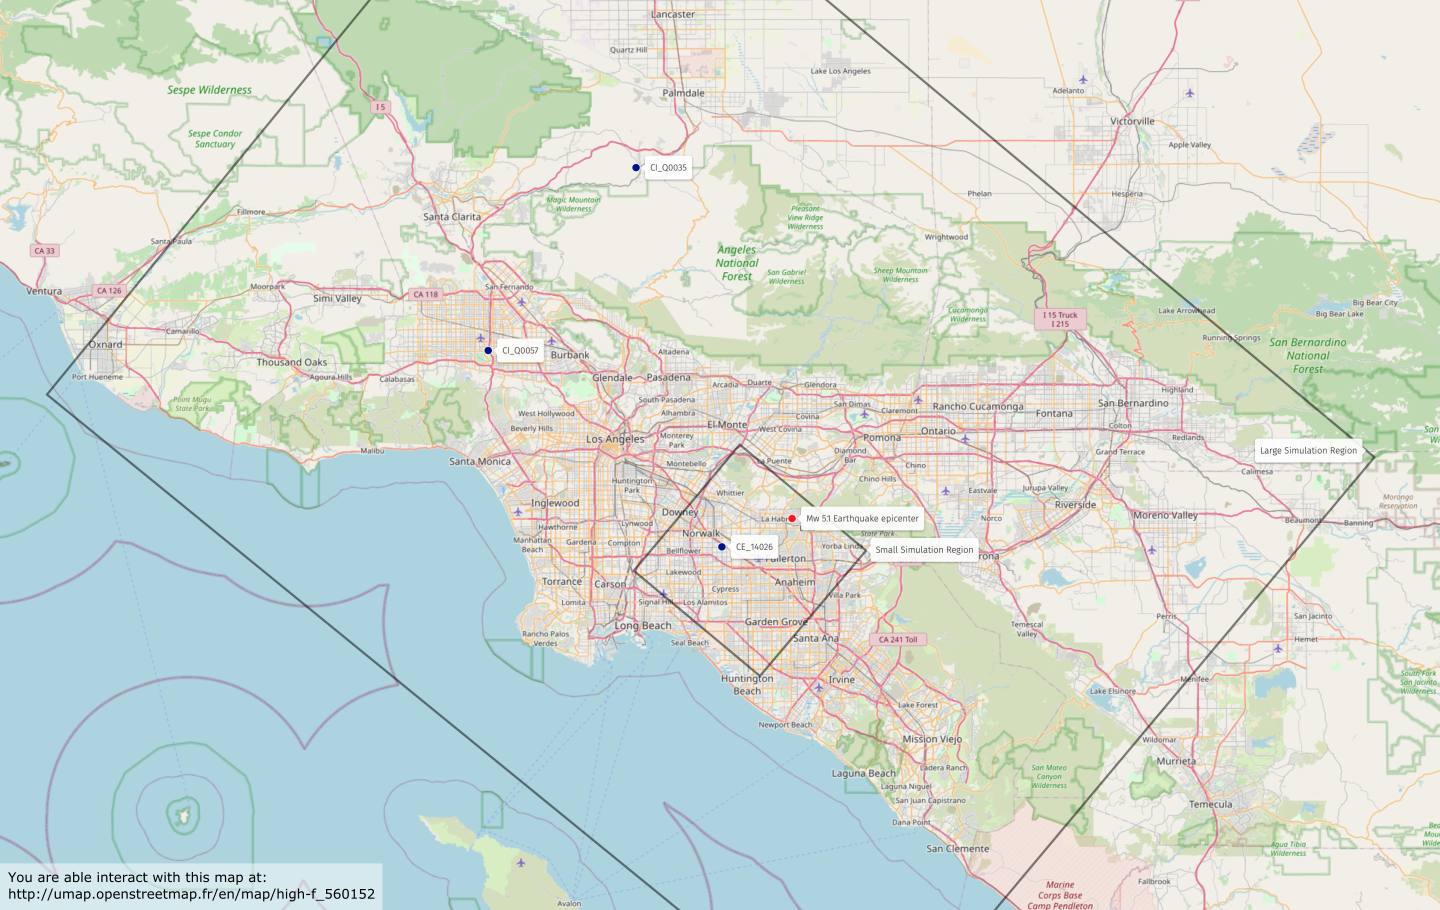
Study area of the Southern California Earthquake Center’s High Frequency project simulating the 2014 M5.1 La Habra, California earthquake. Shown are the “small domain” through the inner box and partially the “large domain” through the outer box. Additionally the locations of the epicenter and three stations are given.

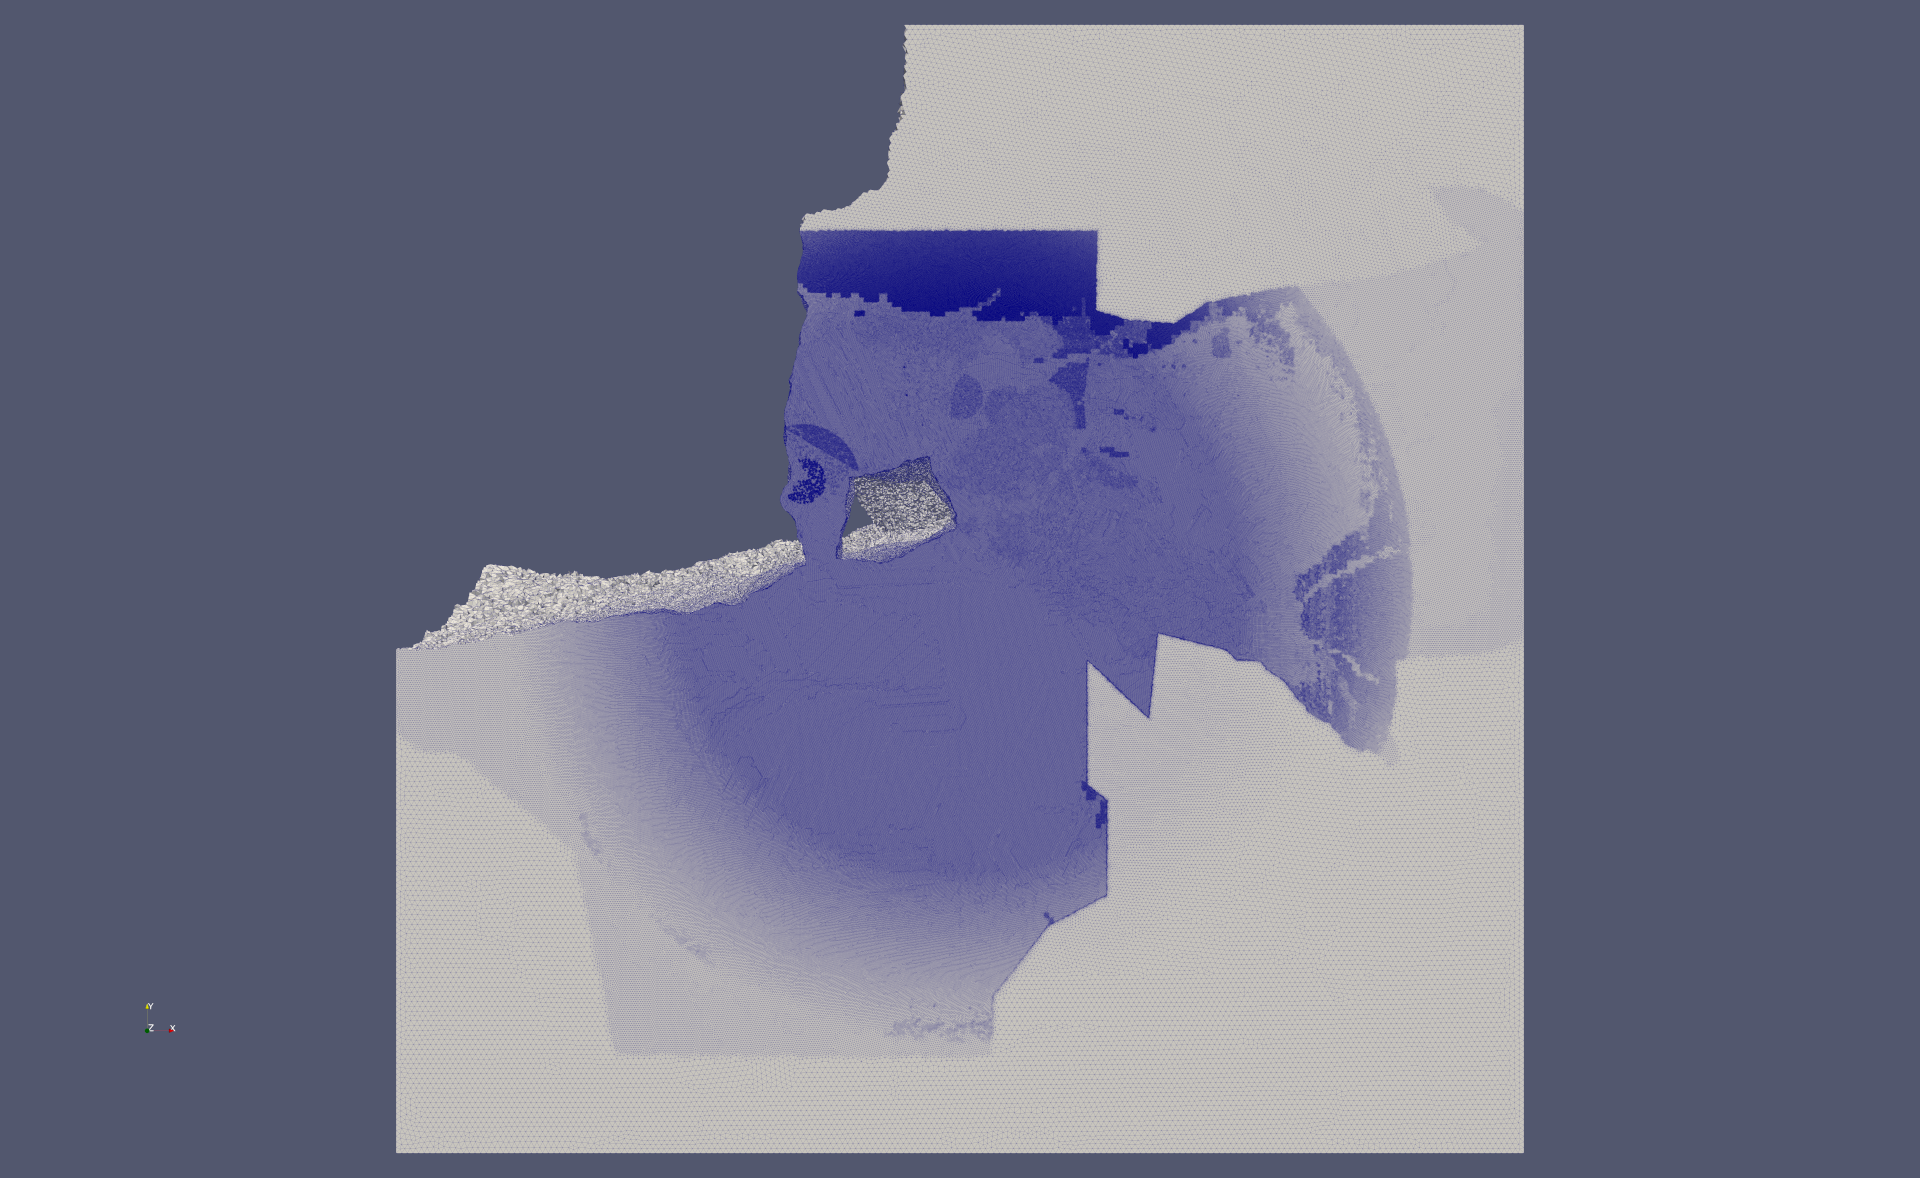
Visualization of a velocity-aware tetrahedral mesh for the small simulation region shown above. The example shows a highly increased mesh resolution in the near- surface parts of the Los Angeles basin. Some partitions in the North-West part of the computational domain are excluded. The epicenter is located in the center of the computational domain. The user also defined a cylindrical high-resolution region around the epicenter in addition to the velocity-derived target edge- lengths.

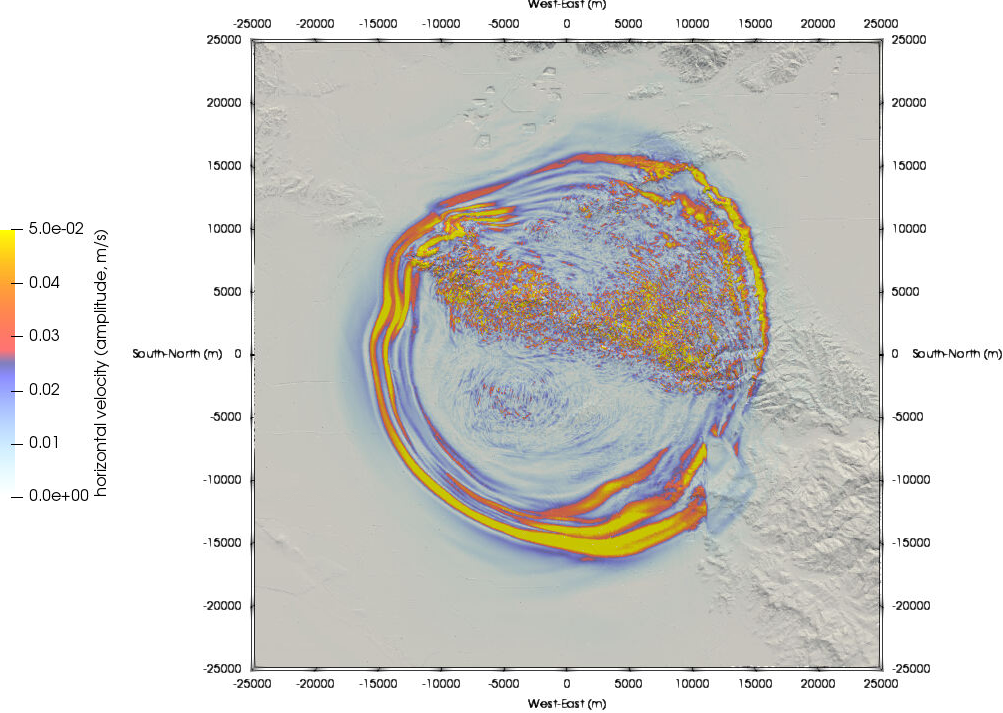
Visualization of the seismic wave field for a simulation of the 2014 Mw 5.1 La Habra Earthquake. Shown are the amplitudes of the horizontal particle velocities after seven seconds of simulated time. In addition to the High-F verification efforts, this simulation included mountain topograhy.
Comparison of EDGE’s South-North velocity component (red) to another solver of the High Frequency project (black). Shown are synthetic seismograms for the three stations depicted in above. The seismograms were low-pass filtered at 5Hz. EDGE’s respective ground motion simulation harnessed 1,536 nodes of the Frontera machine for a total of 48 hours to advance the used 2.1 billion tetrahedral element-mesh in time.